How to Read a Heatmap: A Practical Guide
Heatmaps are only useful if you know how to interpret them. This guide walks you through reading click, scroll, and movement heatmaps with actionable tips.
A heatmap looks simple — red means hot, blue means cold. But extracting real insights from heatmap data requires understanding context, patterns, and what to look for. This guide teaches you how to turn heatmap colors into concrete improvements.
Understanding the Color Scale
Heatmap colors follow a thermal gradient:
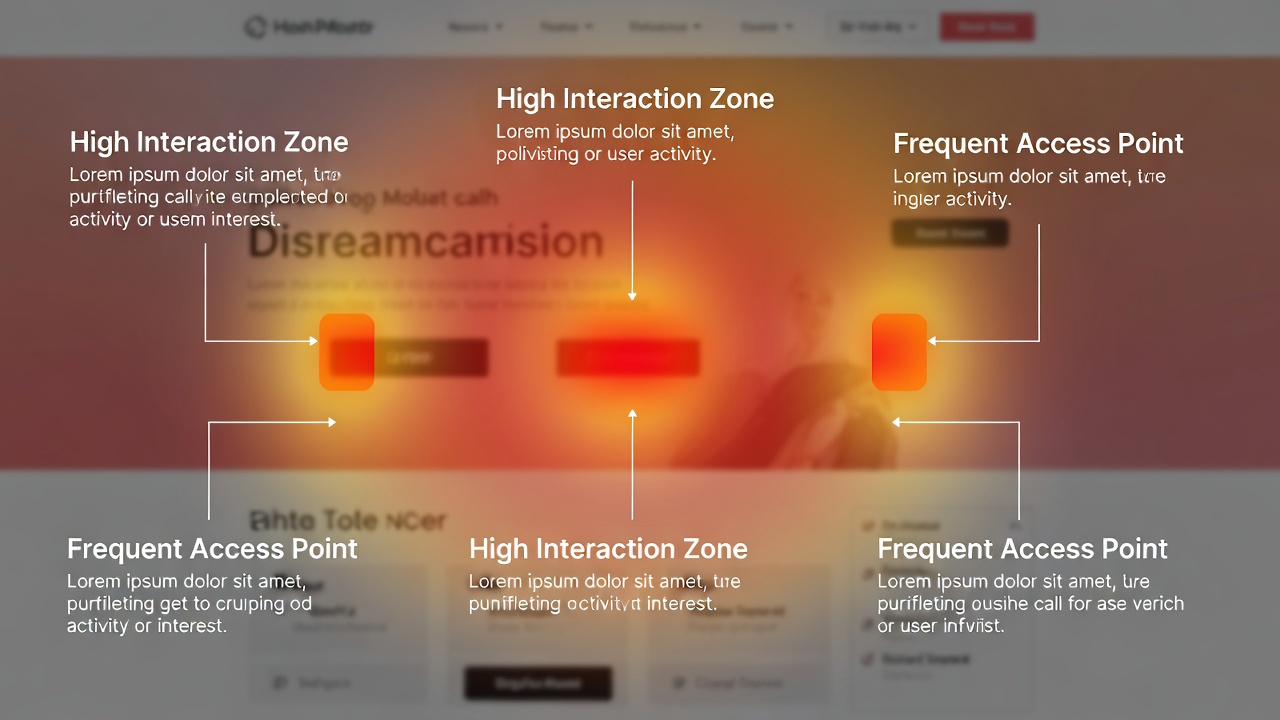
Red: Highest activity. Many users interacted with this area.
Orange: High activity. Significant user attention.
Yellow: Moderate activity. Some users interacted here.
Green: Low activity. Few interactions in this area.
Blue: Minimal activity. This area is largely ignored.
Reading Click Heatmaps
Click heatmaps show where users click or tap. Here is what to look for:
Ghost Clicks
Clusters of clicks on elements that are not actually clickable (images, text, non-linked headings). This means users expect that element to do something. Fix it by either making the element interactive or changing its visual styling so it does not look clickable.
Ignored CTAs
If your primary call-to-action button shows low activity (cool colors), something is wrong. It might be below the fold, blending into the design, or surrounded by distracting elements. Consider making it more prominent, changing its color, or moving it higher on the page.
Navigation Patterns
Check which navigation links get the most clicks. If most users only click 2-3 links, consider simplifying your navigation. If important pages are rarely clicked, they may need better labels or more prominent placement.
Reading Scroll Heatmaps
Scroll heatmaps show how far down a page users scroll. The color gradient runs from warm (top) to cool (bottom).
Finding the Fold Line
The “fold” is where the visible area ends without scrolling. On scroll heatmaps, you will often see a sharp color transition at this point. If critical content or CTAs sit below this line, many users will never see them.
Content Drop-Off Points
Look for sudden color changes in the scroll map. These indicate sections where users lose interest and stop scrolling. If you see a steep drop-off at 30% of the page, the content at that point might need reworking.
Optimal Content Length
Scroll maps reveal how much content users actually consume. If less than 20% of users reach the bottom of your page, it may be too long. Consider shortening it or front-loading the most important information.
Reading Move Heatmaps
Move heatmaps track mouse cursor movement, which research shows correlates roughly with eye movement. They reveal where users are looking, even if they are not clicking.
The F-Pattern
On content-heavy pages, users often read in an F-pattern: across the top, then down the left side with occasional horizontal scanning. Design your layout to place key information along these paths.
Hover Hesitation
Prolonged cursor hovering over a specific element (like pricing or a feature description) suggests the user is considering that information carefully. If you see hover clusters on pricing, users might be comparing or trying to understand your pricing structure.
Turning Insights into Action
- Prioritize by impact: Focus on high-traffic pages first. Small improvements on popular pages have the biggest overall effect
- Cross-reference with analytics: Combine heatmap data with bounce rates and conversion data to prioritize fixes
- Test changes: Do not just implement changes — A/B test them and compare heatmaps before and after
- Segment your data: Desktop and mobile heatmaps often tell very different stories. Always analyze them separately
- Look at trends, not snapshots: One day of heatmap data can be misleading. Gather at least a week of data before drawing conclusions
Common Mistakes When Reading Heatmaps
- Not enough data: A heatmap based on 50 sessions is unreliable. Wait for at least 1,000 sessions before analyzing
- Ignoring context: A click heatmap alone does not tell you if the clicks were successful. Combine with session replays
- Mixing devices: Desktop and mobile behavior is fundamentally different. Always segment by device type
- Confusing correlation with causation: A hot area does not necessarily mean a successful area. Users might be clicking because they are confused