AI Chart Intelligence, LTV Cohorts, and Webhook Automation
AI-powered insights on every chart, lifetime value cohort analysis, webhook automation, and 80+ new free tools. Here is everything new in Zenovay this week.
This week we shipped one of the most requested features at Zenovay: AI-powered intelligence directly on your charts. Combined with lifetime value cohort analysis, webhook automation, a redesigned revenue tab, and over 80 new free web tools, this has been one of our biggest weeks yet. Here is everything that landed.
AI Chart Intelligence — Insights on Every Chart
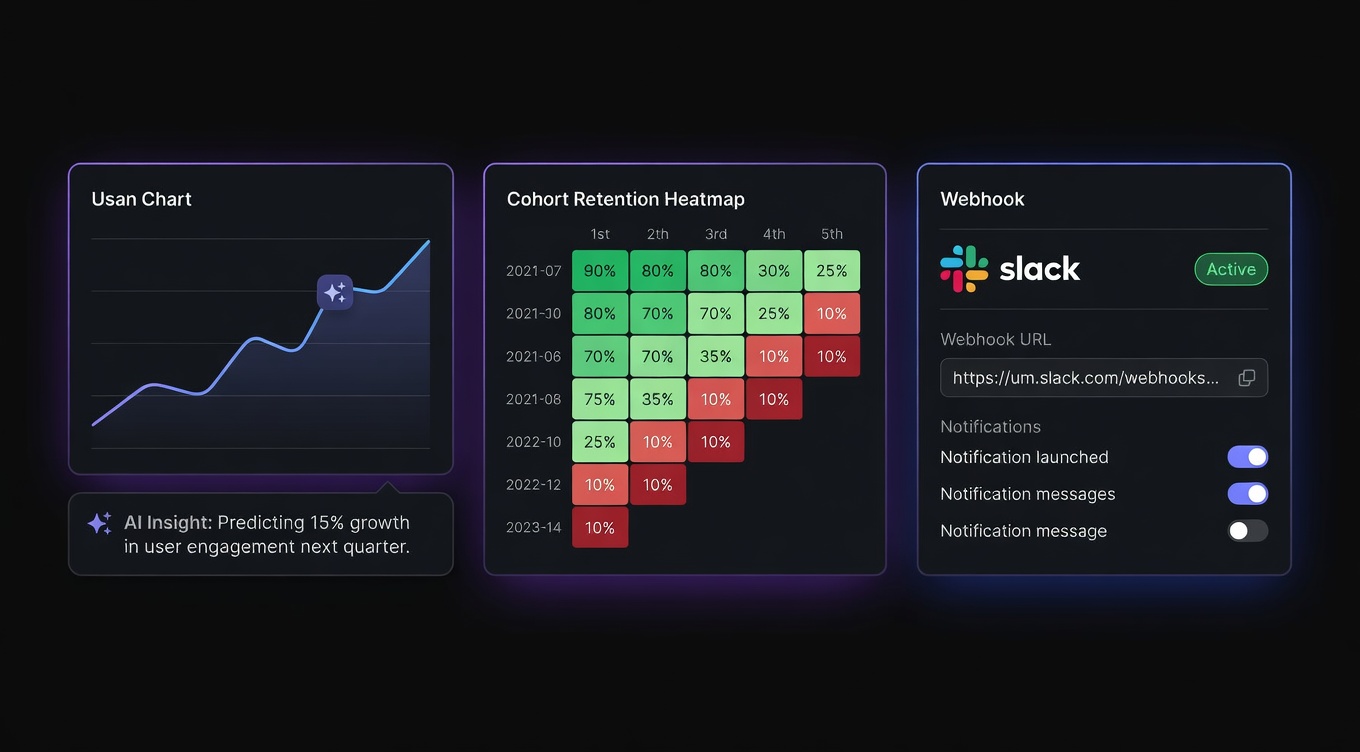
Every chart in your Zenovay dashboard now has an AI brain behind it. Click the new AI Analysis button on any chart and a slide-over panel opens with a detailed, contextual breakdown of what the data means — trends, anomalies, and actionable recommendations.
The AI does not just describe numbers. It reasons through your data step by step, showing its thinking process in real time. You can copy insights, resize the panel, and start a new analysis session at any time. The system pulls in rich context including traffic sources, pages, countries, devices, UTM parameters, and revenue metrics to deliver genuinely useful intelligence.
Below each chart, a new narrative strip provides a concise, one-line AI summary so you can scan dashboards faster without opening the full analysis panel. Think of it as an always-on analyst watching your data.
LTV Cohort Analysis
The new LTV Cohort Analysis view lets you track how customer lifetime value evolves over time. Group users by their sign-up month and watch revenue accumulate across cohorts — a critical metric for subscription businesses and SaaS products.
You can toggle between retention and LTV views using a new URL parameter (`?view=ltv`), making it easy to bookmark or share direct links to either perspective. The empty state guides you through connecting your first revenue source if you have not set one up yet.
Revenue Tab Redesign
The Revenue tab has been completely rebuilt. Controls now live inside the chart area for a cleaner layout, and two new stat cards surface your most important revenue numbers at a glance. A new period dropdown lets you slice revenue data by custom date ranges.
The Revenue by Source table now shows real favicons for each source, is capped at five rows with an expandable “Show more” toggle, and is fully sortable. Period selection persists across interactions so you do not lose context while exploring.
Webhooks and Automation Rules
Zenovay now supports webhook notifications and automation rules directly from your dashboard. Configure webhooks to fire when specific events occur — a spike in traffic, an error threshold breach, or a conversion goal hit — and route alerts to Slack, Discord, or any HTTP endpoint.
Automation rules let you define conditions and actions without writing code. Set up rules like “when bounce rate exceeds 60% on mobile, notify the team” and Zenovay handles the rest. The settings panel includes a full webhook management interface with persistence, editing, and testing built in.
Analytics Journeys
A new Journeys tab visualizes the paths users take through your site. See the most common navigation sequences, identify where visitors drop off, and discover unexpected routes to conversion. The journey view supports hostname filtering and multi-step drill-down so you can isolate specific user flows across different domains.
80+ New Free Web Tools
The Zenovay free tools suite at tools.zenovay.com has grown from a handful of utilities to over 100 tools. This week alone we added 80+ new tools spanning security analysis, SEO auditing, developer utilities, and everyday calculators — all free, all translated into six languages.
Highlights include a TLS certificate checker, DNS propagation checker, structured data validator, JSON-to-TypeScript converter, CSS animation generator, and dozens of calculators from loan and BMI to ROI and retirement planning. Each tool works entirely in the browser with no sign-up required.
Improvements and Fixes
- Instant cross-tab logout synchronization for faster session security
- Sortable table columns with smooth animations across all data views
- Skeleton loading states replace spinners on journeys, uptime, and filter views
- Hostname filter improvements with progressive relaxation for empty results
- Command palette now includes MCP and integrations commands
- Google icon replaces loupe emoji in keyword tooltips for clearer branding
- Fixed chart annotation rendering, weekly alignment, and deviation colors
- Resolved filter pipeline bugs affecting page flows, journeys, and drill-down
- Documentation fully translated into all six supported languages
What Is Next
We are doubling down on the AI intelligence layer with richer contextual analysis and proactive anomaly alerts. The webhook and automation system will gain more trigger types and integrations in the coming weeks. And the free tools suite will continue to grow as we work toward 200 tools by mid-year.
As always, we welcome your feedback. If you have suggestions or run into any issues, reach out through the support page in your dashboard.

Andrea Hartmann
Head of Product